First-time home buyers had a standout year in 2023, representing the largest share of total home purchases in recent history. A new Zillow® analysis has unveiled this year’s prime markets for first-time home buyers, where their dollars go further and starter homes are relatively plentiful.
Zillow’s ranking of the best markets for first-time buyers is based on rent affordability (how much of their income a typical household puts toward rent), the share of for-sale listings a typical household can comfortably afford, how stiff the competition is expected to be for those affordable listings, and how many similar-age households ¹ live in the area.
Join us on a tour of the top 10 markets that give aspiring first-time home buyers the best opportunity to break through — half of which are nestled in the heart of the Midwest.
1. St Louis
▪️ Known for the world’s tallest arch, the Gateway Arch
▪️ Rent affordability: 19.9%
▪️ Share of affordable listings: 66.7%
▪️ Affordable listings per 100 renters: 3.4
▪️ Share of similar-age households: 26.0%

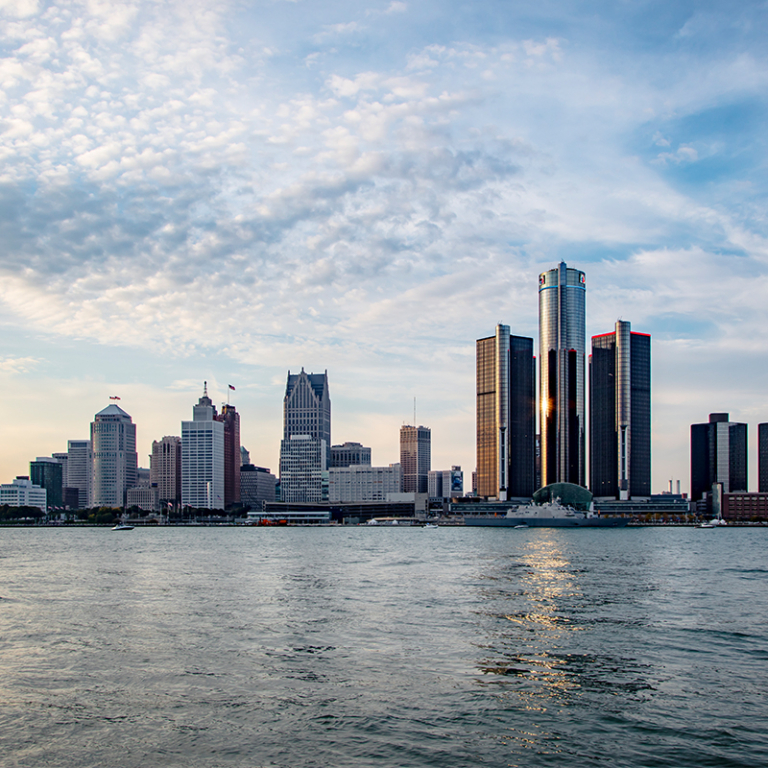
2. Detroit
▪️ The automotive capital of the world. home to iconic car manufacturers
▪️ Rent affordability: 21.5%
▪️ Share of affordable listings: 63.6%
▪️ Affordable listings per 100 renters: 4.0
▪️ Share of similar-age households: 24.3%

3. Minneapolis
▪️ Known as the “City of Lakes” and home to Mall of America
▪️ Rent affordability: 19.8%
▪️ Share of affordable listings: 48.4%
▪️ Affordable listings per 100 renters: 2.5
▪️ Share of similar-age households: 28.1%
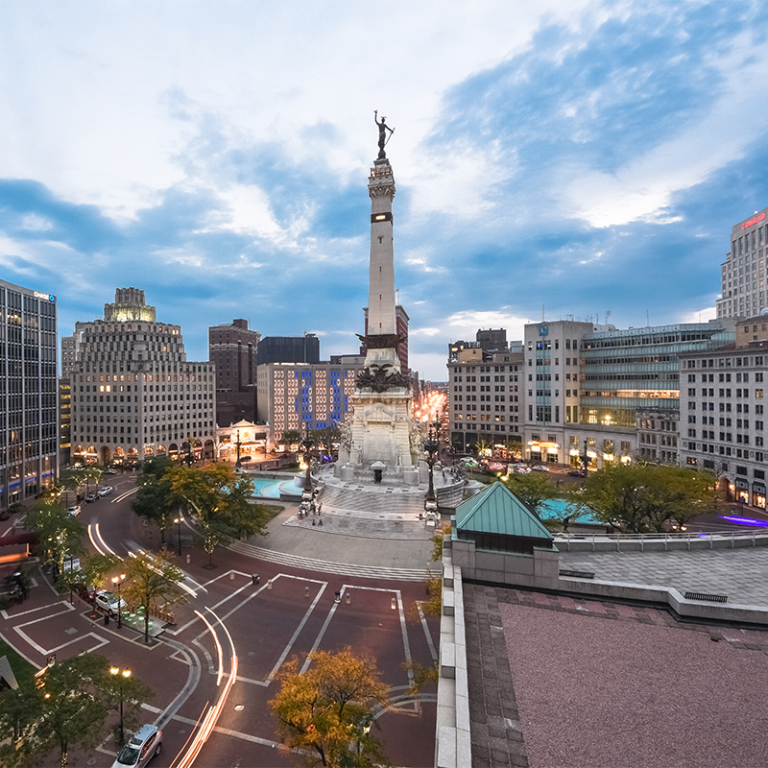
4. Indianapolis
▪️ The state capital and site of the prestigious Indy 500 auto race
▪️ Rent affordability: 22.0%
▪️ Share of affordable listings: 50.4%
▪️ Affordable listings per 100 renters: 2.6
▪️ Share of similar-age households: 28.9%
5. Austin
▪️ Texas’ state capital, famous for its delectable barbecue
▪️ Rent affordability: 20.3%
▪️ Share of affordable listings: 23.0%
▪️ Affordable listings per 100 renters: 1.3
▪️ Share of similar-age households: 33.6%
6. Pittsburgh
▪️ “The Steel City,” pivotal in shaping the US steel industry
▪️ Rent affordability: 21.9%
▪️ Share of affordable listings: 62.9%
▪️ Affordable listings per 100 renters: 3.7
▪️ Share of similar-age households: 24.4%
7. San Antonio
▪️ Acclaimed for its picturesque River Walk and the historic landmark, the Alamo
▪️ Rent affordability: 22.6%
▪️ Share of affordable listings: 32.8%
▪️ Affordable listings per 100 renters: 2.6
▪️ Share of similar-age households: 30.6%
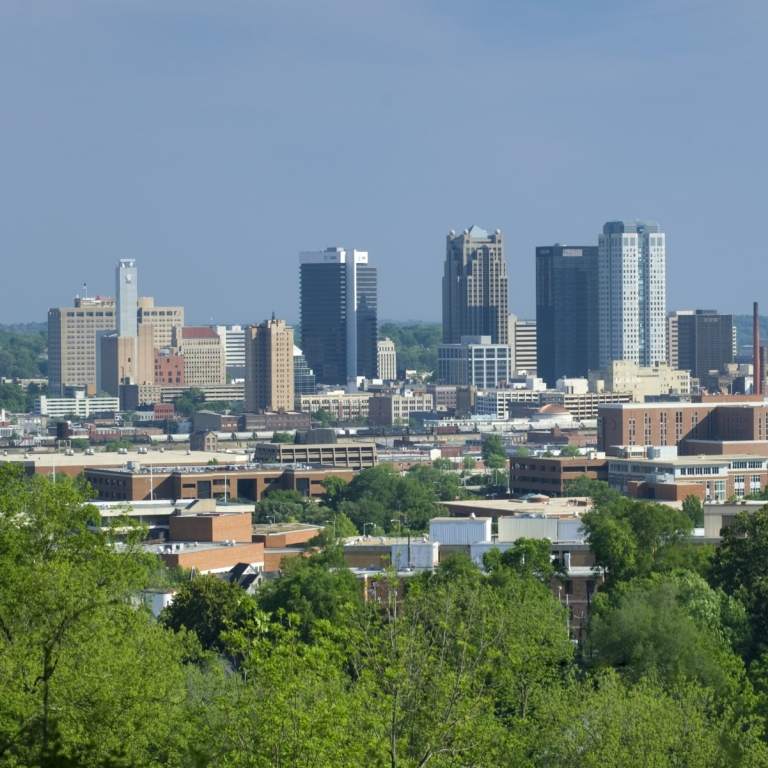
8. Birmingham
▪️ “The Magic City” home to all three essential elements for iron production
▪️ Rent affordability: 22.4%
▪️ Share of affordable listings: 47.5%
▪️ Affordable listings per 100 renters: 4.2%
▪️ Share of similar-age households: 25.3%
9. Kansas City
▪️ The largest city in Missouri, boasting back-to-back Super Bowl champions the Chiefs
▪️ Rent affordability: 21.0%
▪️ Share of affordable listings: 50.6%
▪️ Affordable listings per 100 renters: 2.2
▪️ Share of similar-age households: 27.2%
10. Baltimore
▪️ Famous for its seafood delights, harvested fresh from the Chesapeake Bay
▪️ Rent affordability: 22.2%
▪️ Share of affordable listings: 56.4%
▪️ Affordable listings per 100 renters: 2.3
▪️ Share of similar-age households: 27.1%


